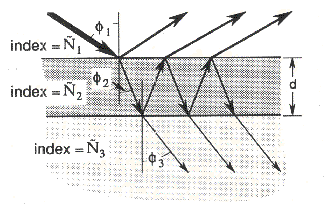
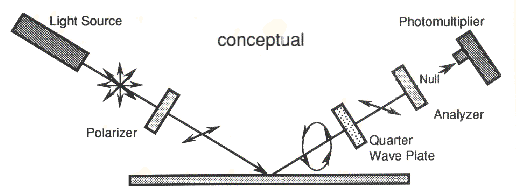
| What is Ellipsometry? Light reflected from a substrate having thin film(s) on top has different phase and amplitude from the incident light.
When liner polarized light is incident to the film(s), the reflected light becomes ellipsoidally polarized. Ellipsometry determines the phase shift angle, usually abbreviated DELTA or shortly DEL, and the magnetite ratio of total reflection coefficients (Rp and Rs in the above equations). The magnitude ratio is given by angle PSI. Carefully-designed ellipsometry experiments provide a lot of useful information. The reflected light is so sensitive to the surface condition to study the behavior of surface atoms such as recombination and relaxation.
tan(PSI) = |Rp|/|Rs| tan(PSI)exp(iDEL) = Rp/Rs Unfortunately, we can not analytically determine the film thickness (d) and refractive index (N) from the measured PSI and DEL values. On the other hand, DEL and PSI can be calculated from d and N. One can therefore determine d and N by using table or chart of DEL and PSI obtained for various d and N combinations. Software bundled with commercial ellipsometers carries out a similar procedure using, for example, the mean-least argorithym. What good of ELLIPSHEET? Calculation of PSI and DEL is not straightforward. Hand figuring is very complex, almost impossible when complex refractive indices are used. But thanks to the computer. ELLIPSHEET calculates DEL and PSI from d, N, substrate refractive index (Ns), incident angle (PHI), and wavelength.
To understand these advantages, let us see weak aspects of ellipsometry. The main application of ellipsometry is the measurement of d and N of thin films. However, d and N data outputted by a commercial ellipsometer is not always 'correct'. As already stressed, ellipsometry with a fixed incident angle cannot analytically determine the 'true' d and N values. The raw data is only PSI and DEL, and the outputted d and N are a possible---hopefully most likely---combination of them. In order to limit the possibilities, one must assume a certain optical model of the sample to measure. One example is a dielectric transparent thin film on a sufficiently thick dielectric substrate (Fig. 1). The ellipsometer's computer does iterative calculations to find (d, N) that gives the measured (PSI, DEL) with using this model. Therefore, besides instrumental inaccuracy, there are at least two major origins of measurement error: optical model and computation (convergence error). Is either wrong, the outputted d and N can be very strange and the measurer will sometimes see 'no answer'. The story stated above is somehow contradictory. Ellipsometry cannot determine d and N but we do 'measure' d and N. Yes, we can determine the d and N values for well-defined and well-understood systems. Thermally-grown silicon dioxide on silicon substrate, such as LOCOS oxide, is an example. In this case, there is no doubt about the optical model from a practical point of view. Moreover, fortunately, a well-trained experimentalist can make a good guess of the optical model. Therefore, in many cases, his/her data is 'correct'. But of course, not always. It is now clear why we need ELLIPSHEET. Putting off the ellipsometer's black-box software, we need a robust, simple, and explicit way to calculate the basic ellipsometric formulas for any given optical parameters. ELLIPSHEET is a very simple Excel spreadsheet; no special input or output windows; nothing clever VBA programmes or macros. Just fill parameters, copy cells, so as to form a table you want. Thus we understand how DEL and PSI behave! Notice
How to Use 1. ELLIPSHEET, Principal Excel Template ellips.xlt zip This worksheet, actually book template, consists of 4 worksheets: "Single Layer", "Substrate Calculation", "Effective Medium", and "Optical Properties". After opening this file, make sure that ANALYSIS TOOL in TOOL/ADD-INs menu is checked. 1) Single Layer This spreadsheet calculates PSI, DEL, and film phase thickness of a single layer film from the thickness, d, film refractive index (complex) N, substrate refractive index (complex) Ns, incident angle, PHI, and wavelength. Cells A7-H7, and J7 are the parameters to fill, and the results appear in Cell AB7, AC8, I7. Cells K7-AA7 are invisible, as their width is set to zero. In order to make a table, copy the 7th row, or drag A7-AC7 to autofill. |
||||
Film and substrate parameters |
Cell |
|||
n1 |
A7 |
Real part of the refractive index of environment (vacuum and air = 1) |
||
k1 |
B7 |
Imaginary part of the refractive index of environment (vacuum and air = 0) |
||
n2 |
C7 |
Real part of the film refractive index |
||
k2 |
D7 |
Imaginary part of the film refractive index |
||
n3 |
E7 |
Real part of the refractive index of the substrate |
||
sk3 |
F7 |
Imaginary part of the refractive index of the substrate |
||
Angle (Phi1) |
G7 |
Incident angle (deg) |
||
L |
H7 |
Light wavelength (angstrom) |
||
Film Thickness |
J7 |
Angstrom |
||
Results |
||||
DELTA |
AB7 |
(deg) |
||
PSI |
AC7 |
(deg) |
||
Period |
I7 |
Periodical film thickness (angstrom) |
||
| 2) Substrate Calculation This worksheet calculates the complex refractive index of a substrate from its PSI and DEL. Unlike the case of a thin film on substrate, the substrate refractive index can be analytically calculated. If any film present on a substrate, an apparent or effective substrate index is obtained. |
||||
Film and substrate parameters |
Cell |
|||
n1 |
A6 |
Real part of the refractive index of environment (vacuum and air = 1) |
||
k1 |
B6 |
Not used |
||
DELTA |
C6 |
(deg) |
||
PSI |
D6 |
(deg) |
||
Angle (Phi1) |
E6 |
Light incident angle (deg) |
||
Results |
||||
n3 |
O6 |
Real part of the refractive index of the substrate |
||
k3 |
P6 |
Imaginary part of the refractive index of the substrate |
||
| 3) Effective
Medium Approximation This worksheet is to obtain the apparent refractive index of mixed two mediums. For instance porous films and rough surface layers can be modeled as a mixture of the host solid and void. The feature size of the optical body suspended in the host medium should be less than the wavelength. |
||||
| Film parameters | Cell | |||
| n1 | A7 | Real part of the refractive index of medium 1 | ||
| k1 | B7 | Imaginary part of the refractive index of medium 1 | ||
| Medium 1 vol % | C7 | (%) | ||
| n2 | D7 | Real part of the refractive index of medium 2 | ||
| k2 | E7 | Imaginary part of the refractive index of medium 2 | ||
| Results | ||||
| n | Q7 | Real part of the refractive index of the effective medium | ||
| k | R6 | Imaginary part of the refractive index of the effective medium | ||
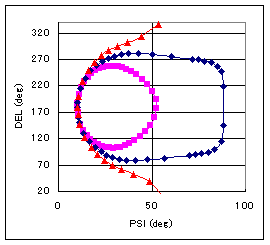
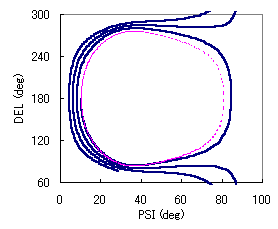
4) Optical Properties List of refractive indices for common materials. 2. Examples 1) Single-layer transparent film on Si. ellips2.xls zip DEL-PSI plots of a transparent single-layer film (k2=0) on Si for n2=1.2, 1.46 (SiO2), and 1.8 with varying thickness, d. In order to determine d and N from the measured DEL and PSI, it is better to make this type of plot first. The number of loops will be 3-5 at first. The thickness d is varied from 0 to ~periodical thickness so as to close the loop. Then put the experimentally obtained (PSI, DEL) point. If this point is far away from the loops you already made, try other N values until the point is located between two loops. Next, 'zoon in' on the point. The goal is to find the curve that passes through the point. Do not 'magnify' too much. Keep the two neighboring curves in view. And repeat the same procedures, by changing d and N, until a plot point on the curve becomes sufficiently close to the experimental point. If the first decimals are in agreement, for most of measurements, OK. Purists may try the second decimal agreement. It is important to notice that the N dependence of DEL and PSI is small for PSI ~ 10 deg. This occurs when the film thickness is close to zero or to the film phase thickness, or when the film has no 'colour'. Since the measured DEL and PSI values should involve some unavoidable inaccuracy, the ellipsometer's output may contain a large error in N ifn PSI ~ 10 deg. On the other hand, measurement accuracy improves for large PSI values, as N dependence of PSI and DEL becomes large. If your film is not transparent, or absorbing, it will take a bit more time (see next section), because there is an additional parameter to vary. You may need additional specimens with different d. Changing wavelength or Phi is also helpful. This sheet helps you to determine appropriate measurement conditions.
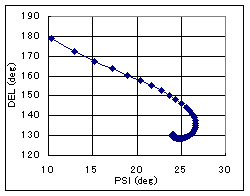
2) Single-layer absorbing film on Si. ellips3.xls zip PSI-DEL plot of W film for various thicknesses. The increment is 20A and the wavelength is 6330A. The trajectory starts from the Si point (10.3, 179.1) and converge to the bulk W point (23.2, 130.1). Absorbing films do not show the periodicity. It is understood that light penetrates into the W film up to about 200A. Thinner films do not show the optical constants of bulk W.
Next example is an absorbing film having a small extinction coefficient (N=1.46-0.02i). That is, this type of film is almost transparent but not perfectly. Compare the curve with that of transparent film (SiO2, magenta). The transparent film shows a closed loop with a period of 3050A, but the loops the absorbing film make do not close.
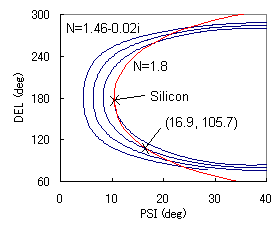
Here is a 'zoom-in' view on silicon point with the curve of a transparent film (N=1.8). The N=1.8 curve goes across the trajectory of the absorbing film many times. This means different (d, N) combinations are possible for the same (PSI, DEL). For instance, the transparent films whose thickness is 285, 2345, 4410, … angstrom gives PSI=16.9 and DEL=105.7, but the absorbing film have a unique thickness of 3420A. Thus is the optical mode important.
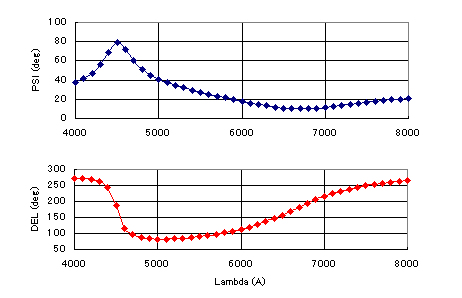
3) Wavelength dependence of DEL and PSI ellips4.xls zip PSI and DEL values of a 3000A-thick SiO2 film on Si as a function of wavelength. This type of measurement is called spectroscopic ellipsometry (SE). SE affords advanced analysis such as multilayer film analysis which is usually very difficult to carry out with a single-wavelength ellipsometry. However, since SE is not more than ellipsometry, we first need an optical model, and calculate PSI and DEL, comparing with the measurement. The tricky part is therefore to have an appropriate model, not calculation itself. This worksheet is applicable to common SE measurements in Si processing.
References
|
||||
